01
Market share by brand
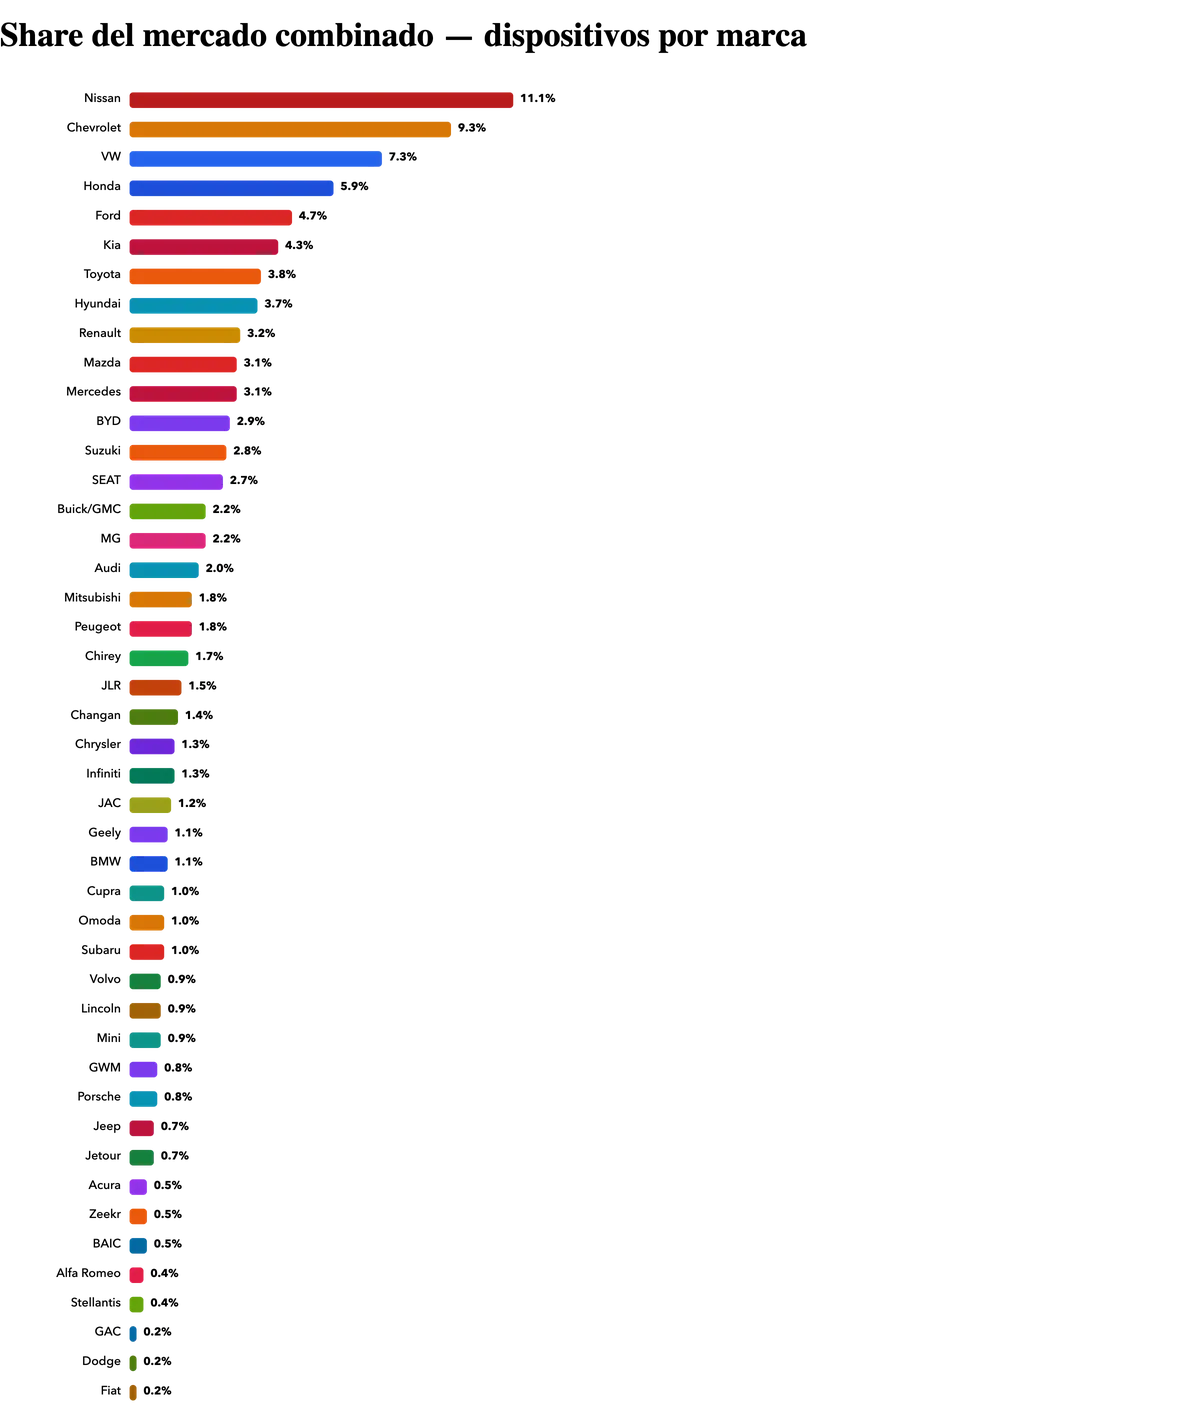
The leader does not reach 12%: the top three brands together fall short of a third of the market.
Mobility intelligence
Over a million devices, 45 brands and 118 days under one single qualification. No anchor brand and no surveys: only the physical visit that already happened.
Read it in full online, no sign-up. To take the PDF with you we ask for your email.
Seven questions that get answered in a budget meeting, not a marketing one.
The leader does not reach 12%: the top three brands together fall short of a third of the market.
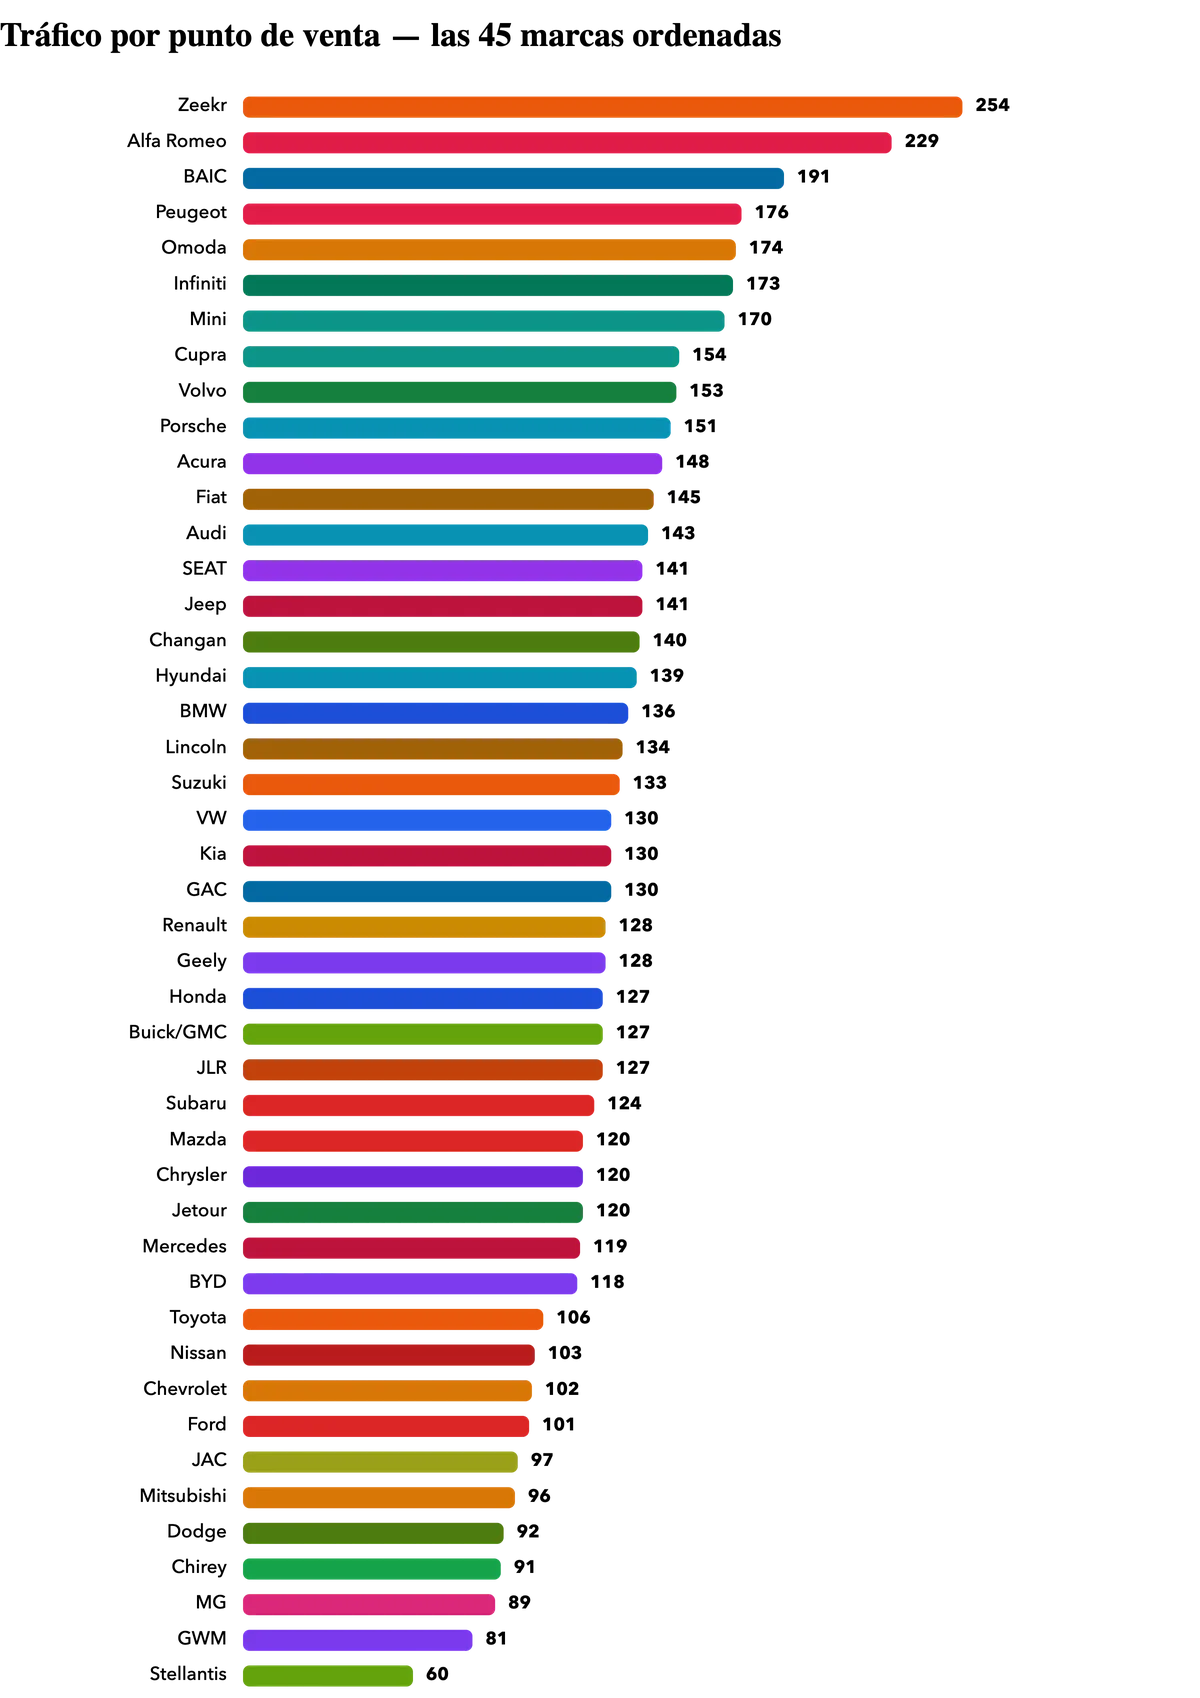
The brand with the most dealerships is not the one drawing the most traffic per dealership: the best per point does it with a network seven times smaller.
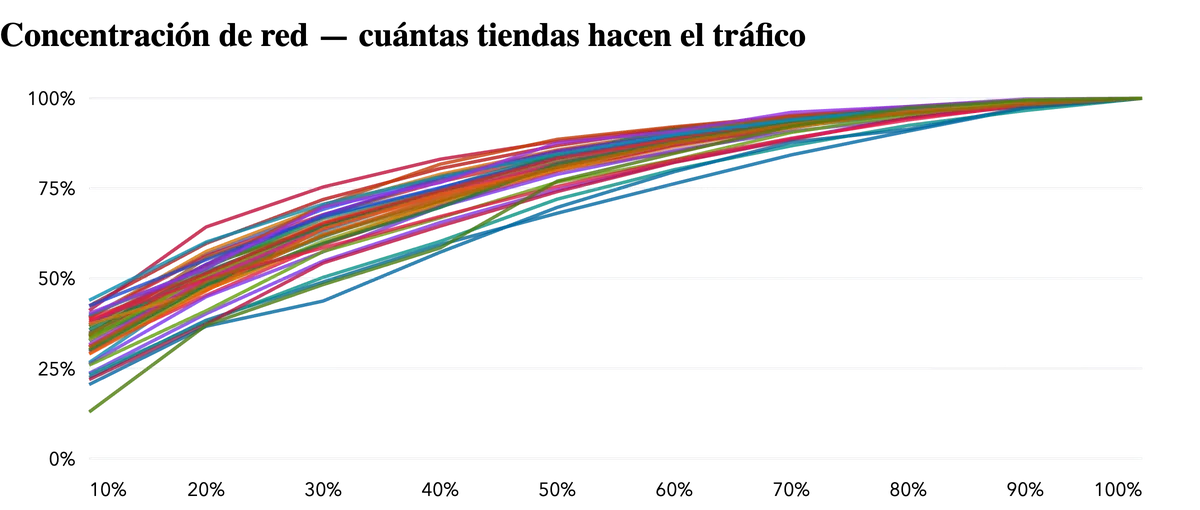
How many dealerships carry the result. Only two brands spread it evenly; the rest live off their flagships.
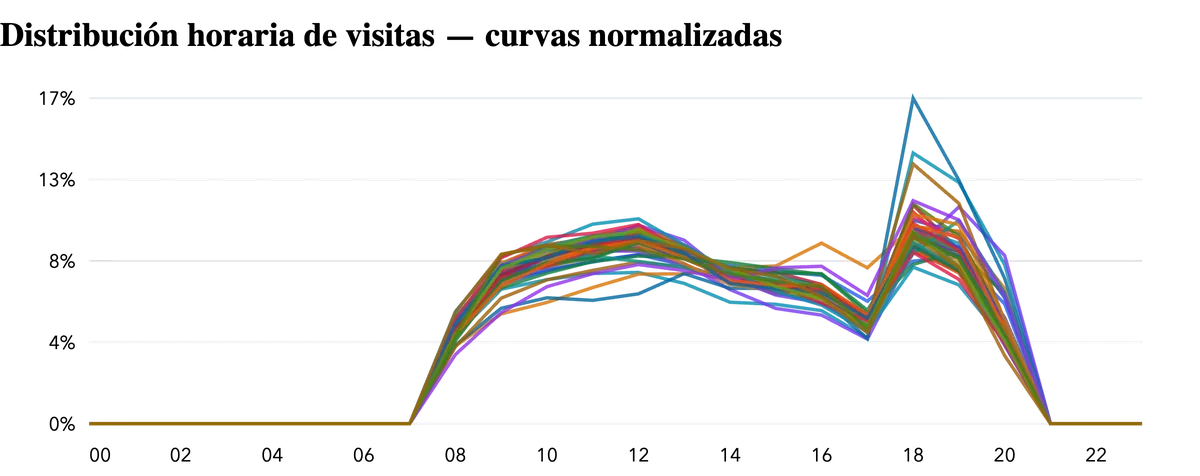
There are brands where one in three visitors arrives between 6 and 8 in the evening. Dwell time, by contrast, barely moves.
The largest pair in the market shares almost 88 thousand devices. Every intersection is an exportable audience.
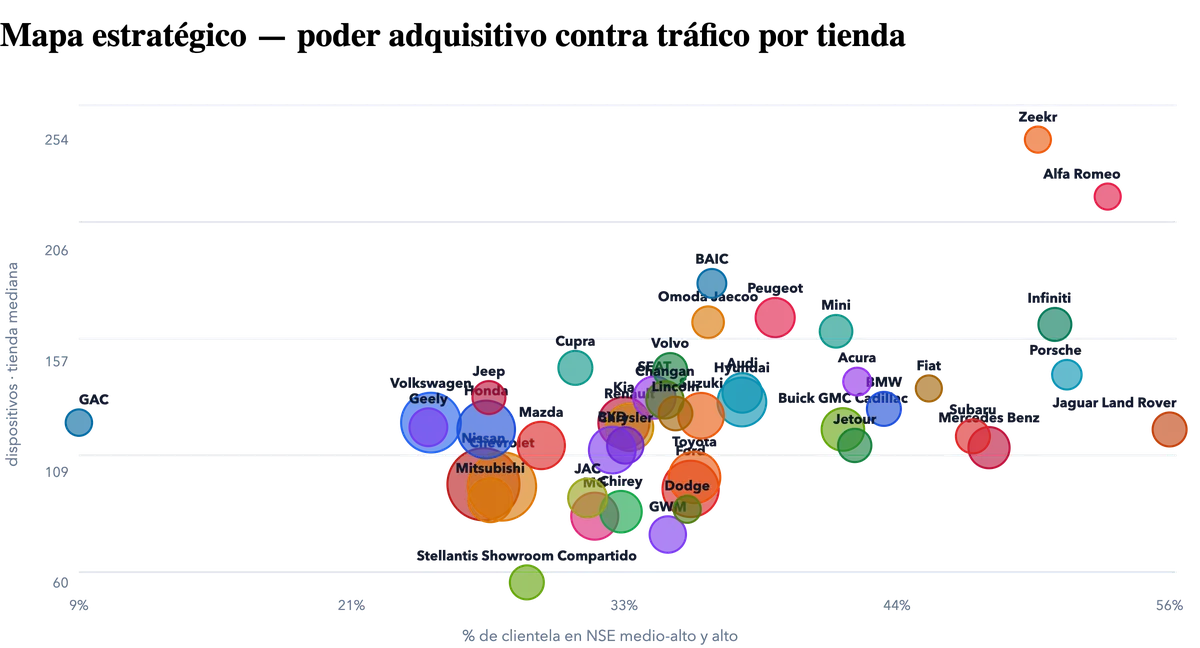
Purchasing power against traffic per dealership: where the volume sits and where the value does.
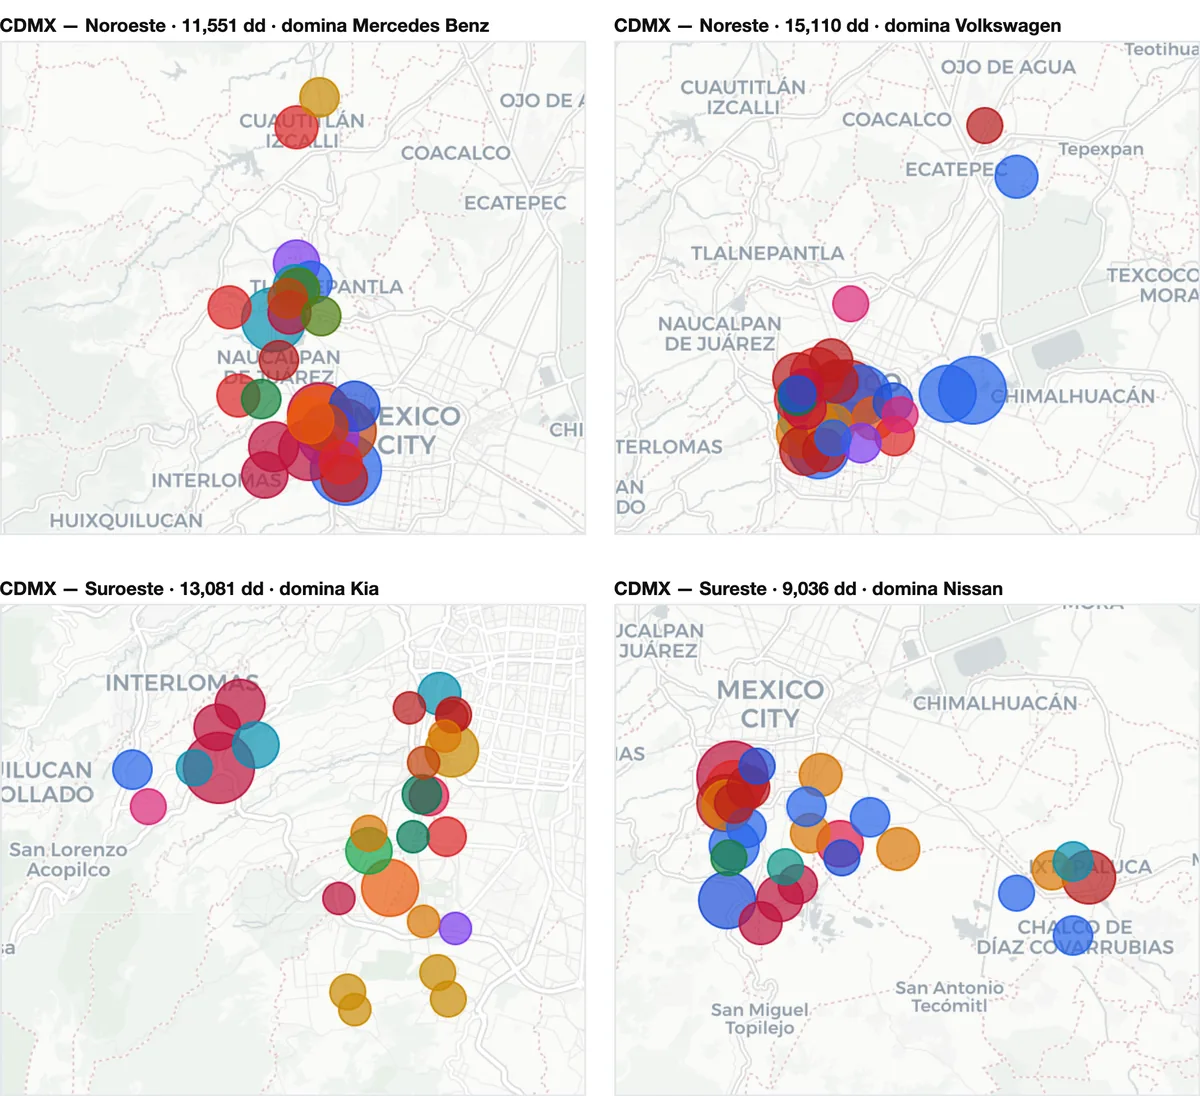
Mexico City, Guadalajara, Monterrey, El Bajío and Veracruz–Puebla: every zone has its local leader.